We are working with our colleagues at the University of Wisconsin-Madison to test and improve their weather based forecasting tool for tar spot on corn. This tool is currently called Tarspotter and is not publicly available. However, I will be posting forecasting maps weekly over the growing season. In this article, I will discuss how to interpret the maps and determine your specific risk level.
First, we need to remember that tar spot is a residue-borne disease. To our knowledge, the tar spot pathogen only overwinters on infected corn residue, and can overwinter at least one year under conditions in Northern Illinois. Under cool, wet conditions, particularly at night, spores are extruded from black stromata on infested residue spread locally and at least nearby (yards). If spores land on susceptible corn and the environment is conducive, infection can occur. After infection, symptoms develop within 2-3 weeks. We still have a lot to figure out regarding the biology of the pathogen, and we are working on aspects of this in our lab. Since 2015, we have observed this disease every year in Northern Illinois to some extent, but typically not until late in the season, when things cool down and yield has been made in the crop. However, as we saw last season, if tar spot starts early in crop development (Before R2-3) we can see significant yield losses. Our delayed planting this season might mean that tar spot could be an issue again this year. Therefore it is important to stay ontop of scouting your fields for this disease.
Based on what I describe above, it makes sense that corn fields that are no till, corn-after-corn, and that had tar spot last year will be at the highest risk for seeing tar spot earlier this season if conditions are conducive. Where was tar spot detected last year? Below is a link to the distribution of tar spot in 2018.
Tar Spot established in the United States-2018
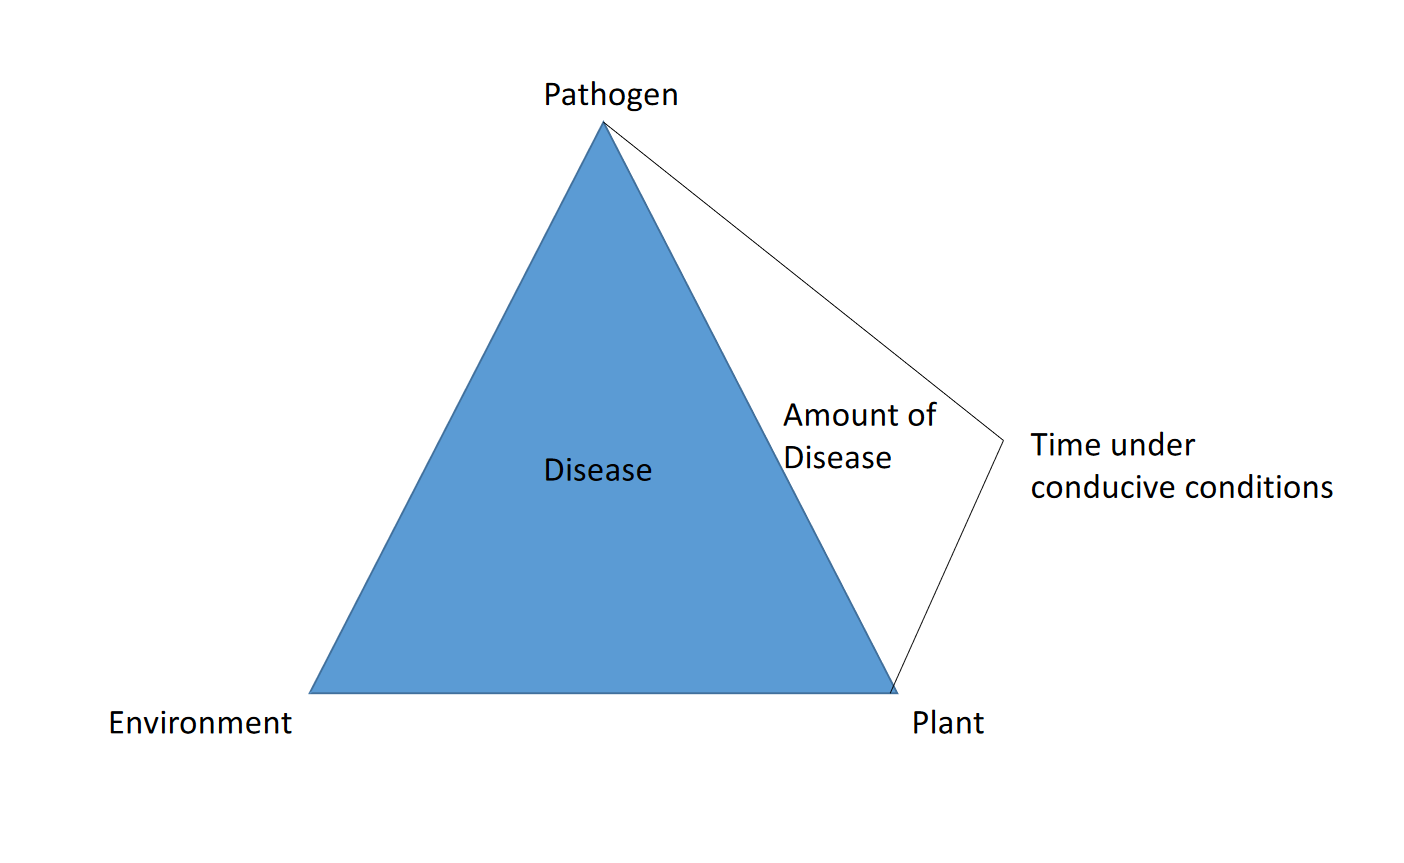
Remember that plant disease develops only when the pathogen is present on a susceptible host and the environment is conducive. The amount of disease is related to the duration of time that is spent within optimal conditions. The amount of initial inoculum also can influence disease severity and disease progress.

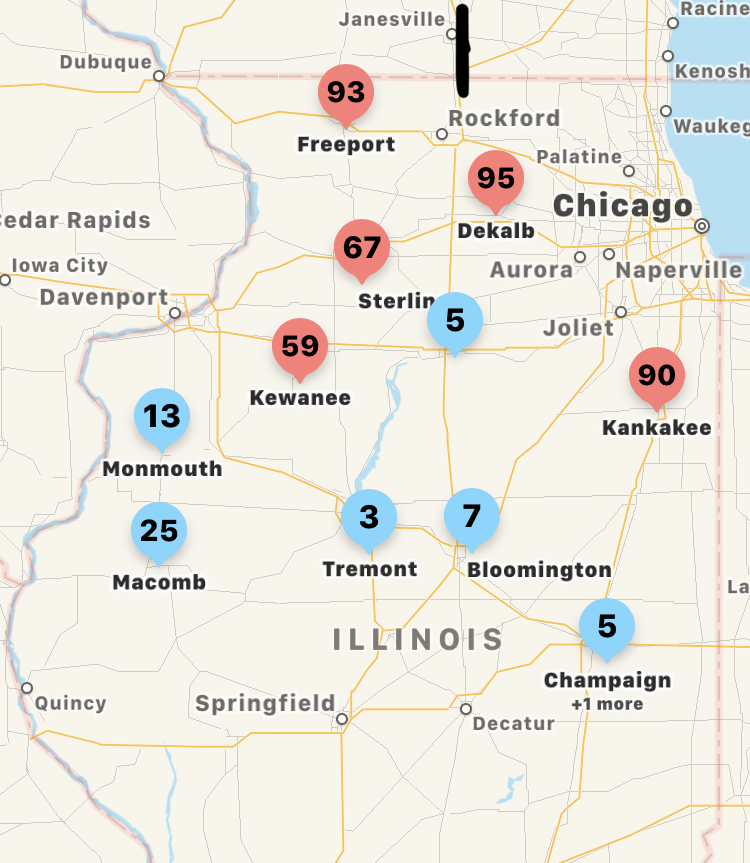
The Tarspotter maps I will post will tell you the overall risk for seeing tar spot given that you have a susceptible host and the pathogen is present. It reads similar to a weather forecast in that it provides a likelihood of seeing tar spot based on historical weather data (temperature, relative humidity, etc). Thus, if you have a field of corn planted into corn residue that was infected with the tar spot pathogen last season and your risk level today says 90%, the model is telling you that you have favorable conditions for infection and you might see symptoms start on existing foliage in 2-3 weeks.
When risk is over 30%, and the corn is between V8 and R2-3, then an in season application of a mixed mode of action fungicide might be justified for suppressing tar spot. Recent studies indicate that fungicide applications made at VT/R1 are the most likely to pay (click here for more information).
Below is the risk map for today, 6/24/2019. As you can see, conditions in Northern Illinois has been the most conducive for tarspot. Conversely, even though it has been wet at our site in Champaign, other factors, likely temperature, have kept our overall risk for disease relatively low.

In sum, when you view the tar spot risk map, take into account your crop history with tar spot, severity of the disease last season, and corn growth stage at the point in time that the map was generated, to determine if in season management might be needed for this disease.
